Serial Femtosecond Crystallography
Current crystallography methods require mesoscopic crystals that can take many years of research to obtain. We are currently developing a novel concept for structure determination, where single shot diffraction patterns are collected from a stream of nanocrystals, using femtosecond pulses from an X-ray Free Electron Laser (XFEL). Almost half a decade before the availability of any XFEL, researchers had already realized that the very high dose rates delivered by their short and intense pulses might be a suitable strategy for reducing the amount of damage suffered by a specimen during its irradiation, allowing much smaller crystals to be examined than previously thought possible [1]. The principle is simply that the minuscule duration of the X-ray pulse would not allow for any of the normal atomic rearrangements occurring due to radiation damage to proceed to a significant extent. Although the dose given to the specimen might be far in excess of what it could normally tolerate, the X-ray pulse is over — and therefore the information useful for structure solution already measured — before the specimen is destroyed. The validity of this approach was demonstrated in 2005 with a two dimensional specimen using a soft X-ray free-electron laser- FLASH [2], and it has now been applied directly to macromolecular crystallography.
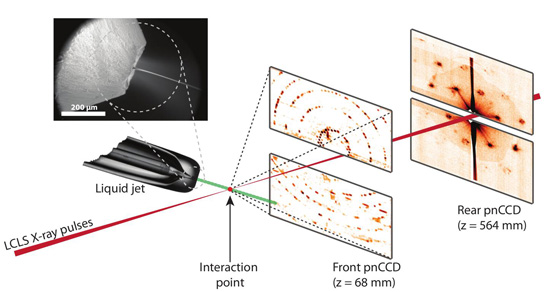
Each crystal is hit by a single X-ray pulse, forming a single diffraction pattern before being vaporized as a nano-plasma burst. The diffraction patterns are read out by a set of detectors, such as the two sets shown in Figure 1. The detector closest to the interaction region records scattering to large angles corresponding to high resolution, while the other detector records lower angle scattering showing detail of the structure of the first few diffraction orders. From the patterns on the far detector, the shapes of the crystals themselves could be reconstructed using the normal algorithms of diffractive imaging, allowing their sizes to be measured and potentially providing additional information that could be used for de novo phasing.

Figure 1
Experimental set-up for serial femtosecond crystallography. First published in Nature 470, 73 – 78 (2011).
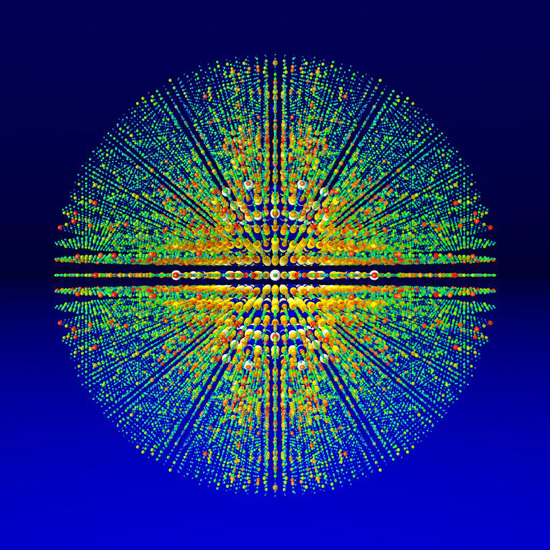
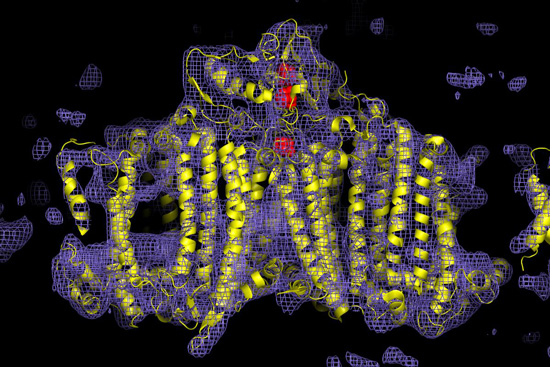
The patterns on the near detector are processed in largely the same way by the normal procedures of indexing (orientation determination) and peak intensity measurement followed by merging the measurements from a large number of patterns — over 15,000 in our initial proof of concept, and over 100,000 in current experiments. Fully automated processing using specialized software developed in the Coherent Imaging Division of CFEL at DESY- CrystFEL software suite [4] combines the intensities from all the patterns by a “Monte Carlo” merging process [3], leading to a three-dimensional dataset visualized in Figure 2. Such datasets are processed further using standard macromolecular crystallography software to produce electron density maps. An example is shown in Figure 3 where key features of the huge photosystem I protein complex can be clearly resolved, such as its trans-membrane helices, its chlorophyll molecules and iron-sulphur clusters.
In a recent study [5], the structure of Trypanosoma brucei Cathepsin B together with its inhibitory propeptide was determined utilizing the X-ray pulses from the Linac Coherent Light Source (LCLS), a hard X-ray FEL. Trypanosoma brucei is a single-celled parasite that causes African sleeping sickness, and Cathepsin B is an enzyme that is essential to the life cycle of that parasite. This experiment traversed new territory by combining two innovations: Serial Femtosecond Crystallography and in vivo crystallization of heterologous protein. For the first time, an XFEL was used to solve an unknown protein structure. The dimensions of the crystals are limited by the size of the cells. These tiny crystals could not have been successfully used to unravel its structure with the use of conventional X-ray sources due to miniscule size of the crystals. Cathepsin B was expressed and crystallized in SF9 insect cells. A liquid jet with crystal suspension at a flow rate of 10µl/minute was utilized to deliver the sample to the X-ray interaction region. The average crystal size was 0.9x0.9x11µm3. Approximately 5 ml of crystal suspension containing approximately 2x10^8 crystals per ml was used.
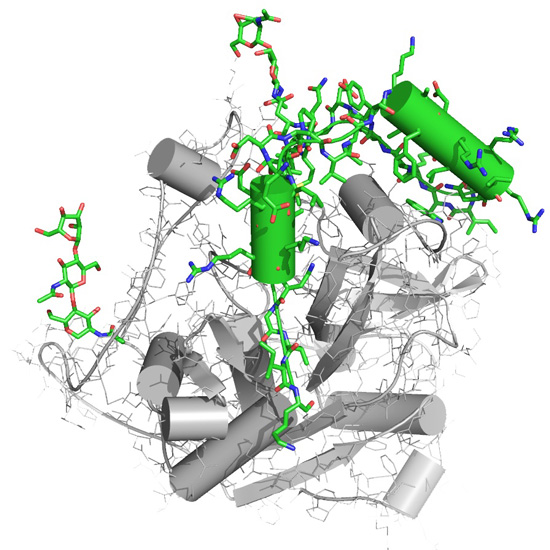
In total, there were 3,953,201 X-ray pulses used for Cathepsin B sample producing about 100 TB of data. Using multi-threaded software developed by our group, we identified a sum of 293,195 snapshots that contained protein crystal diffraction. In addition, we performed automated indexing and merging of diffraction patterns in multi-threaded manner using the CrystFEL software suite [4]. In order to determine the structure, 178,875 individual diffraction patterns were successfully indexed (in less than 8 hours). If the time spent on processing one image was 1 second and the analysis was not multithreaded, analysis of only Cathepsin B data would take more than a month and for the whole 60 hours experiment about one year. A final representation of Trypanosoma brucei Cathepsin B molecular structure is illustrated in Figure 4.

Figure 2
Three dimensional visualization of diffraction intensities determined by combining over 15,000 individual single-shot diffraction patterns from the photosystem I protein complex, acquired using LCLS. Image courtesy: Thomas White, CFEL

Figure 3
Electron density map of the photosystem I protein complex obtained from the LCLS diffraction data. First published in Nature 470, 73 – 78 (2011). Nanocrystals were grown by Petra Fromme of Arizona State University.

Figure 4
A representation of the molecular structure Trypanosoma brucei cathepsin B. The new components of this structure revealed for the first time by an XFEL, the inhibitory propeptide and carbohydrate chains, important to understanding the Cathepsin's B native inhibitory mechanism, are colored in green. Image courtesy: Karol Nass, CFEL